Position, Velocity, and Acceleration Graphs
Author: Tegan Durishin
Lab Partners: Anthony Farano & Thatcher David
Date Completed: 31 March 2014
Author: Tegan Durishin
Lab Partners: Anthony Farano & Thatcher David
Date Completed: 31 March 2014
purpose
The purpose of this lab is to create graphs and relate kinematics to position, velocity, and acceleration v. time graphs.
theory
We used the kinematic equations for this lab. The first equation is to find time, the second determines final velocity, and the third will help for calculating acceleration. We can assume that acceleration is constant within each equation.
mnbkj hjbjknjknhu t = ( x frames / 1) * (1sec / 30 frames)
d = ½ (Vf + Vi)t, Vi = 0
d = ½ (Vf)t
(Vf)t = 2d
Vf = 2d/t
Vf = Vi + at, Vi = 0
a = Vf / t
mnbkj hjbjknjknhu t = ( x frames / 1) * (1sec / 30 frames)
d = ½ (Vf + Vi)t, Vi = 0
d = ½ (Vf)t
(Vf)t = 2d
Vf = 2d/t
Vf = Vi + at, Vi = 0
a = Vf / t
experimental technique
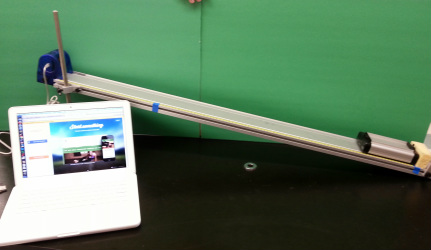
For this experiment, one needs quite a few materials. These include an incline plane, a laptop, a motion sensor, a cart, a metal clamp stand, a foam stopping block, and Microsoft Excel. In order to gather information correctly, one must set the inclined plane to a desired angle, connect the motion sensor to one end, and have your partner release the cart down the decline. Additionally, you should record a video of the cart rolling down the plane so that you can determine time, based upon the number of video frames. Once these procedures are complete, one can begin to calculate formulas and needed info.
DAta
Vi = 0 m/s
d = .94 m
a = 1.17 m/s/s
t = 1.27 s
Vf = 1.48 m/s
d = .94 m
a = 1.17 m/s/s
t = 1.27 s
Vf = 1.48 m/s
analysis
t = ( x frames / 1) * (1sec / 30 frames)
t = (38 frames / 1) * (1 sec / 30 frames)
t = 1.27 seconds
Vf = 2d/t
Vf = 2(94cm) / 1.27sec
Vf = 148.0 cm/s
Vf = 1.48 m/s
a = Vf / t
a = 1.48 m/s / 1.27 s
a = 1.17 m/s/s
t = (38 frames / 1) * (1 sec / 30 frames)
t = 1.27 seconds
Vf = 2d/t
Vf = 2(94cm) / 1.27sec
Vf = 148.0 cm/s
Vf = 1.48 m/s
a = Vf / t
a = 1.48 m/s / 1.27 s
a = 1.17 m/s/s
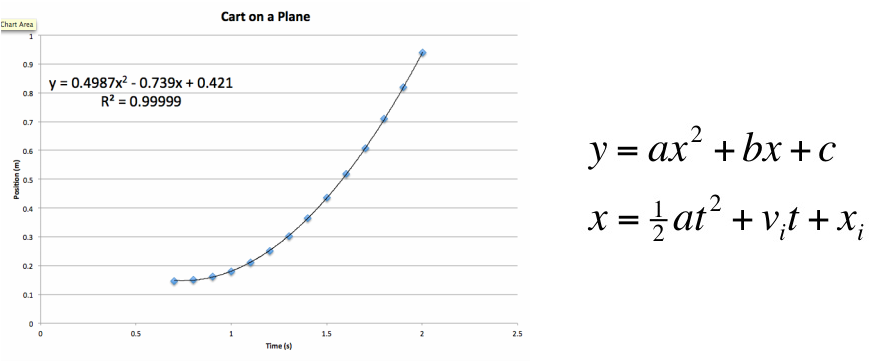
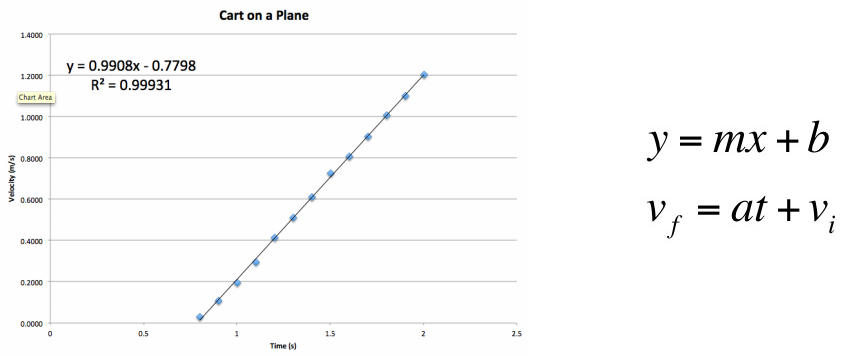
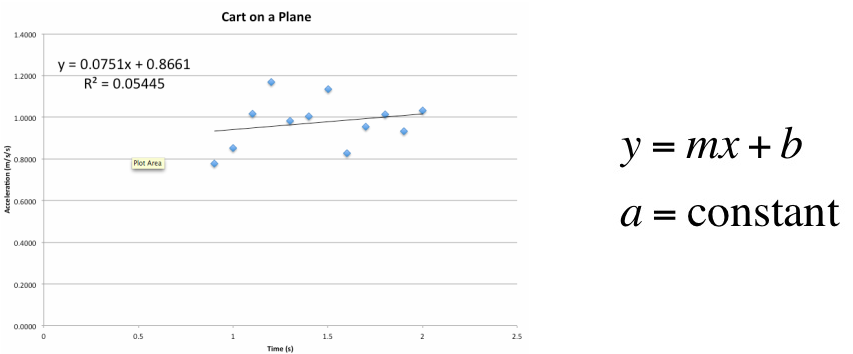
conclusion
Throughout the PVA graphs lab, we needed to prove the relationship between the kinematic equations. We already knew the distance from measuring the length between the two pieces of tape on the incline. We were able to easily find the time through counting the number of frames in the video since 1 second = 30 frames. The last piece of data we knew was (Vi), since the cart is at rest when it is released, it is zero. Knowing these, we could find the final velocity, and acceleration through using the kinematic equations. After finding the variables in the kinematic equations, we were able to graph them. We made three graphs, a position vs. time graph, a velocity vs. time graph, and an acceleration vs. time graph. Although acceleration is constant throughout all of these graphs, the acceleration vs. time graph is not constant. There were no major issues with error in this experiment.
references
Doug, B. (2014). Kinematics. (Master's thesis, Lehighton Area High School).
